Watch IODA’s Animation Videos: Understanding Internet Connectivity One Signal at a time
After launching our first set of user guides explaining how and when to use IODA to monitor for Internet disruptions, we received valuable feedback from our community. While many users quickly grasped how to spot an Internet disruption, there was a need for deeper understanding—not just of what the signals show, but how we collect and interpret the signal data. To address this, we’re excited to announce a new signal animation video for IODA users designed to demystify the core signals that power IODA: Active Probing, BGP, and Telescope.
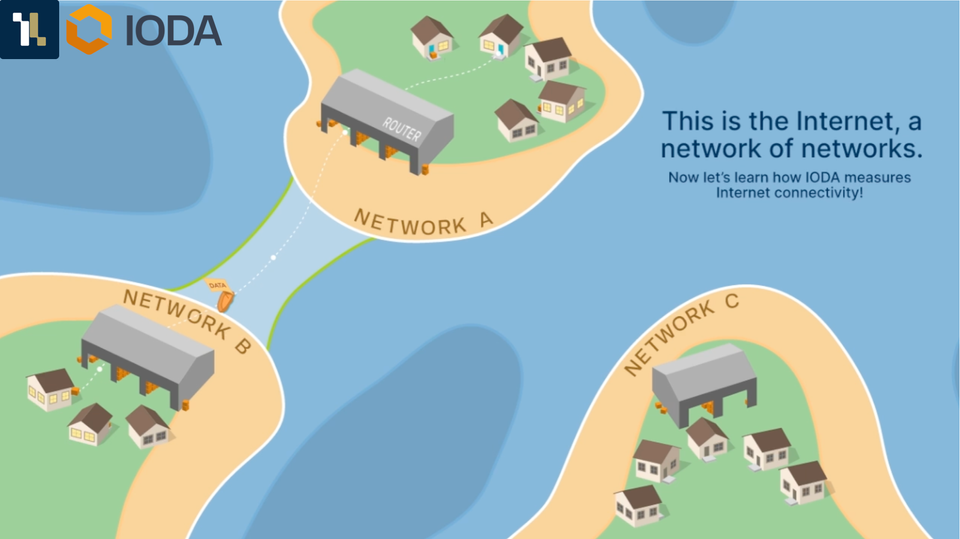
Understand how IODA measures Internet connectivity one signal at a time!
Why Animate IODA's Signals?
IODA’s mission is to detect and analyze macroscopic Internet outages in near real-time, providing actionable data and insights for network operators, researchers, and the public. We know that improved Internet literacy empowers our users to interpret IODA’s data more effectively. By using illustration and analogy, our new signal animation videos break down the technical processes behind each signal, making the invisible world of Internet measurement visible and intuitive.
Our videos include an intro explaining the overview of how the Internet works followed by an explanation of each signal:
- BGP (Border Gateway Protocol): BGP is the protocol that routers use to guide data across networks. By monitoring global BGP announcements, IODA can see when large sections of the Internet become unreachable.
- Active Probing: This method involves sending probes from Georgia Tech servers to a large fraction of the global IPv4 address space to infer when blocks of networks are active or inactive.
- Telescope (Internet Pollution): A network telescope looks at unused Internet address space to find unsolicited Internet traffic. If a region or network suddenly stops emitting this unsolicited traffic or "pollution,” it may indicate a connectivity loss or outage event.
Each signal provides a unique lens on Internet connectivity issues.
Building a More Informed Community
Our vision is to build a community of users who not only monitor Internet disruptions, but also understand the signals behind the alerts. Improved Internet literacy makes our data more actionable, whether you’re responding to a crisis, conducting research, or advocating for a more resilient Internet.
We invite you to watch the new signal animation videos and share your feedback to help us make Internet measurement accessible, insightful, and impactful for all. Get in touch via ioda-info@cc.gatech.edu.
These videos would not be possible without the impressive illustration, animation, and design work of Rachel Baker-Ramos and Anezka Virani. We continue to be grateful and impressed by the incredible students at Georgia Tech! These students were advised by Amanda Meng, Zachary Bischof, and Alberto Dainotti.