IODA Update: Design Standards + Outage Severity Map
Design Standard Update
Did you notice recently that the IODA website feels more clean, more uniform?
Well, that's the intentional work of Georgia Tech Computer Science Master's student, Arvin Poddar. This summer we set out to implement a uniform design standard across the IODA website. The updated user interface reflects this work. Not only is the current appearance more sleek, but we are now in a better position to implement future design changes (look for updates in late 2023/early 2024!) All in all, thousands of lines of styling and business logic were removed, along with 16 dependencies!
Overall Outage Severity Map Update
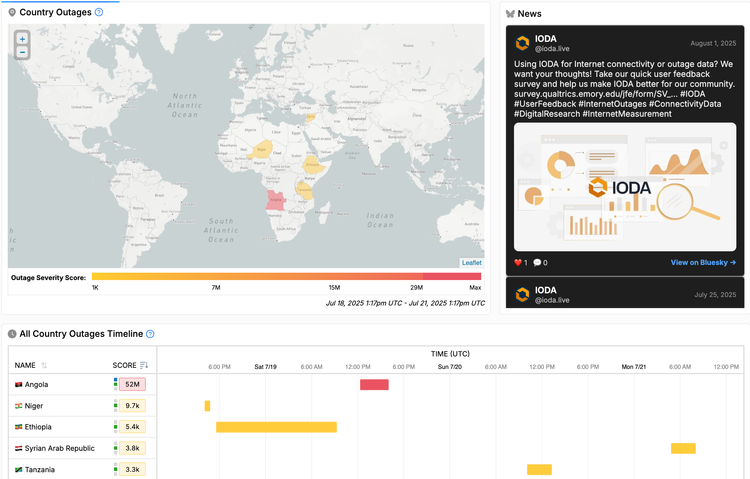
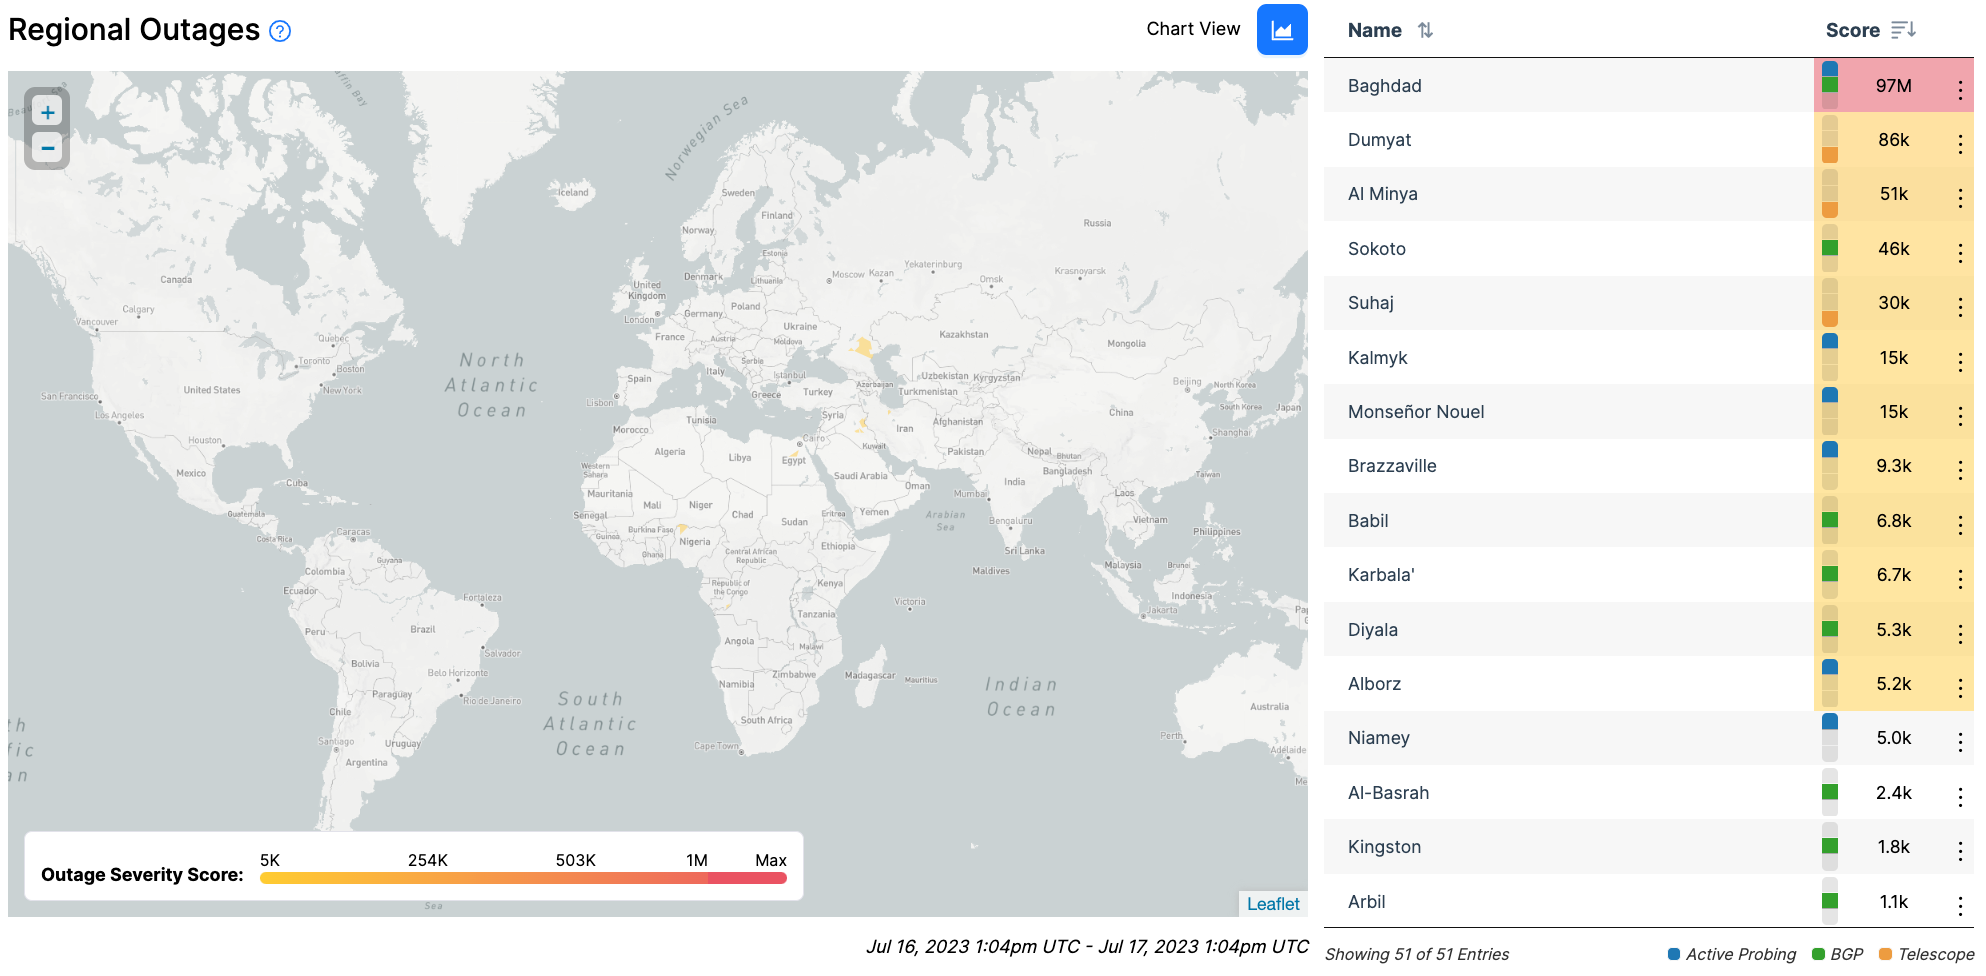
For our engaged users, you will immediately notice a new color scale on our Country and Region Outage Severity Map. This analysis was supported by Georgia Tech Computer Science Master's student, Rameez. Previously, our overall severity score colors were assigned relative to other severity scores for the time frame selected by the user. The higher scores, red and the lowest score, blue. This means, even a low overall severity score could appear red, if it happened to be the highest score during the selected time period. We found this to be misleading for users and that an absolute color scale, where certain overall severity scores are always associated with certain colors was more intuitive.
To identify the appropriate overall severity score color scheme we analyzed 1,417 country outages and 363 regional outages ranging from February 2022 to April 2023. These outages were sourced from our internal database of IODA outages, which we populate daily. Outages were hand inspected and coded with the following outage classifiers: No Significant Outage, Significant Outage - Low, Significant Outage - Medium, Significant Outage - Medium - High, Significant Outage - High, Significant Outage - Highest
We then analyzed the transition points to determine which overall severity outage scores were meaningful break points to assign a new color. This resulted in 3 ranges. The lowest range has no color assigned as we found that outages in this score range did not appear to be significant enough to merit calling out to the user. The second range spans low to high severity, with the color range from yellow to a soft red. The third range is the most severe outage scores, which are assigned the color red. As before, the map colors correspond to the country outage table colors.
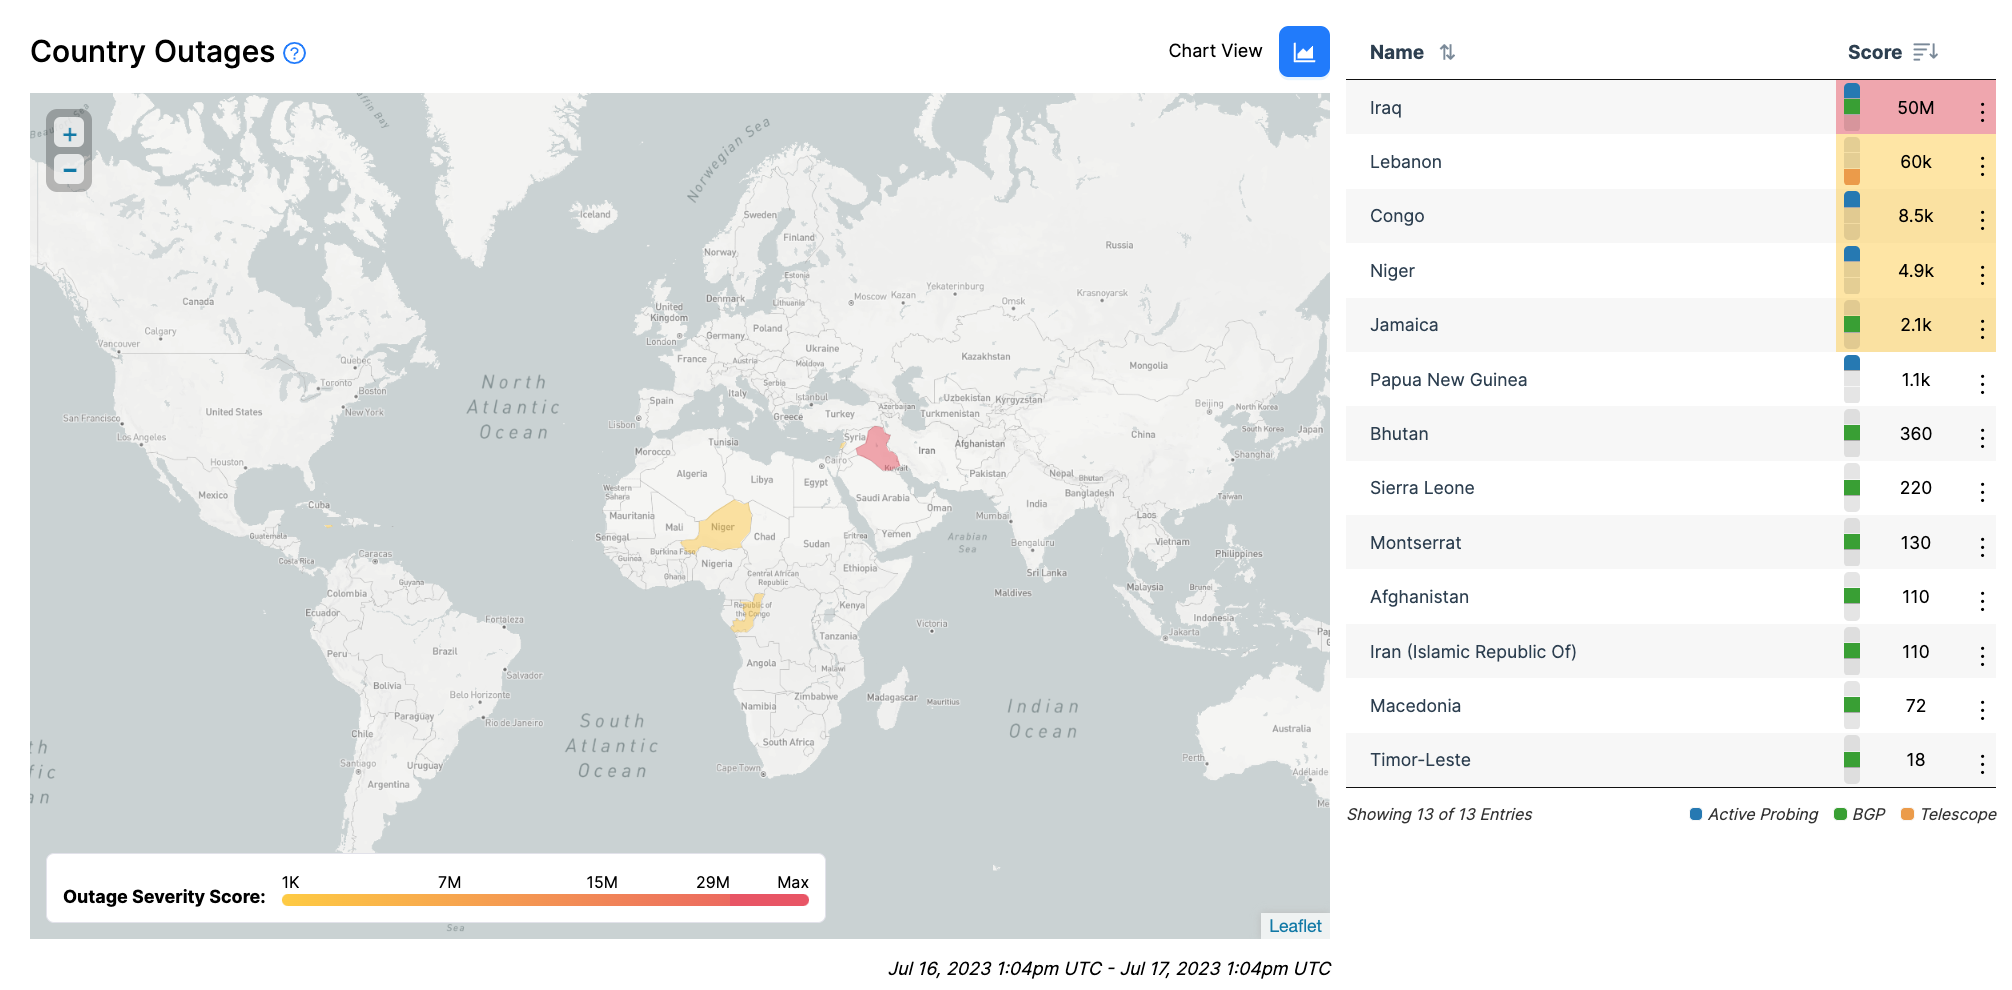
For the map legend (yay, a map legend!), we provide 5 points of reference on the color scale for the user to orient to. Country Outage Severity Score legend: 1K, 7M, 15M, 29M, Max. Regional Outage Severity Score legend: 5K, 254K, 503K, 1M, Max.
For more information on how we calculate our severity outage scores please refer our Help page.
We are grateful for the work of the IODA team in implementing these updates including: Alberto Dainotti, Amanda Meng, Arvin Poddar, Claudia Cho, Leah Cho, Rachel Baker-Ramos, Rameez, Shane Alcock, and Zachary Bischoff.
Please reach out with any questions or feedback: ioda-info@cc.gatech.edu.