IODA Markup Studio and Data Download!
The IODA team is excited to release two new features for our users! The Markup Studio allows users to add text, arrows, shapes, etc to describes the outage cause or sociopolitical contexts related to disruptions in connectivity. We have also enabled users to download connectivity signals to csv!
Markup Studio
Context is critical when sharing reports of Internet disruptions. For this reason, the IODA team takes time to validate outages with other measurement groups and conduct research into the cause or context of outages.
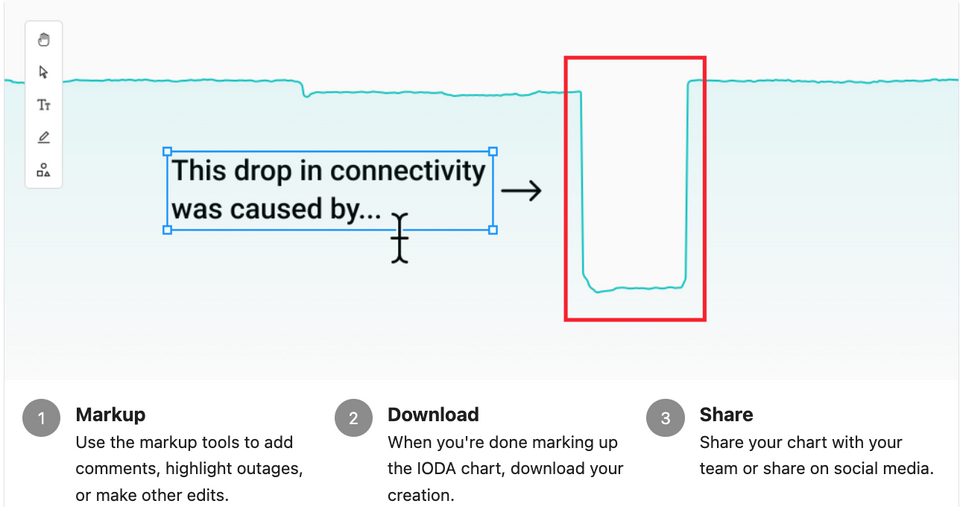
We created the Markup Studio so that our users can contextualize and interpret connectivity signals before sharing IODA charts. You can launch the Markup Studio from the IODA time series chart using the pencil icon. Watch the video below for a quick tutorial. And don't forget to save and share your IODA chart markup!
IODA Markup Studio Tutorial
Tips for the Markup Studio
- Before you launch the Markup Studio, make sure the chart appears just as you want it to... Is the time frame correct? Do you want to remove or add signals? I f you are in Advanced Mode, do you want to remove or add alert bands? Would you like the data to appear as raw values or normalized? ...Once you are in the Markup Studio, you can only add text, objects, and free draw on top of the IODA chart.
- Double check your spelling and grammar. The Markup Studio will not underline a spelling mistke for you.
Data Download
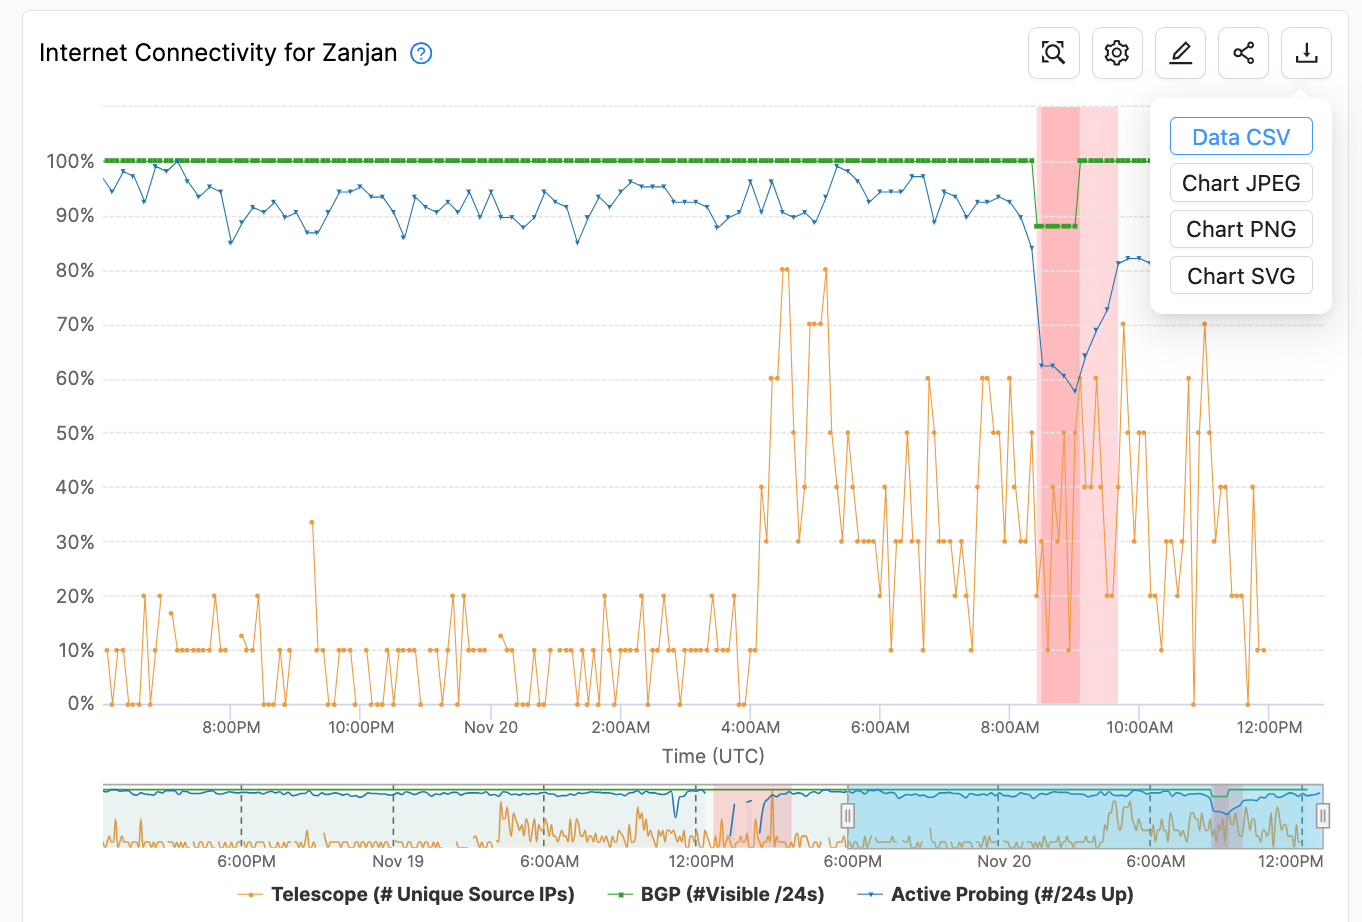
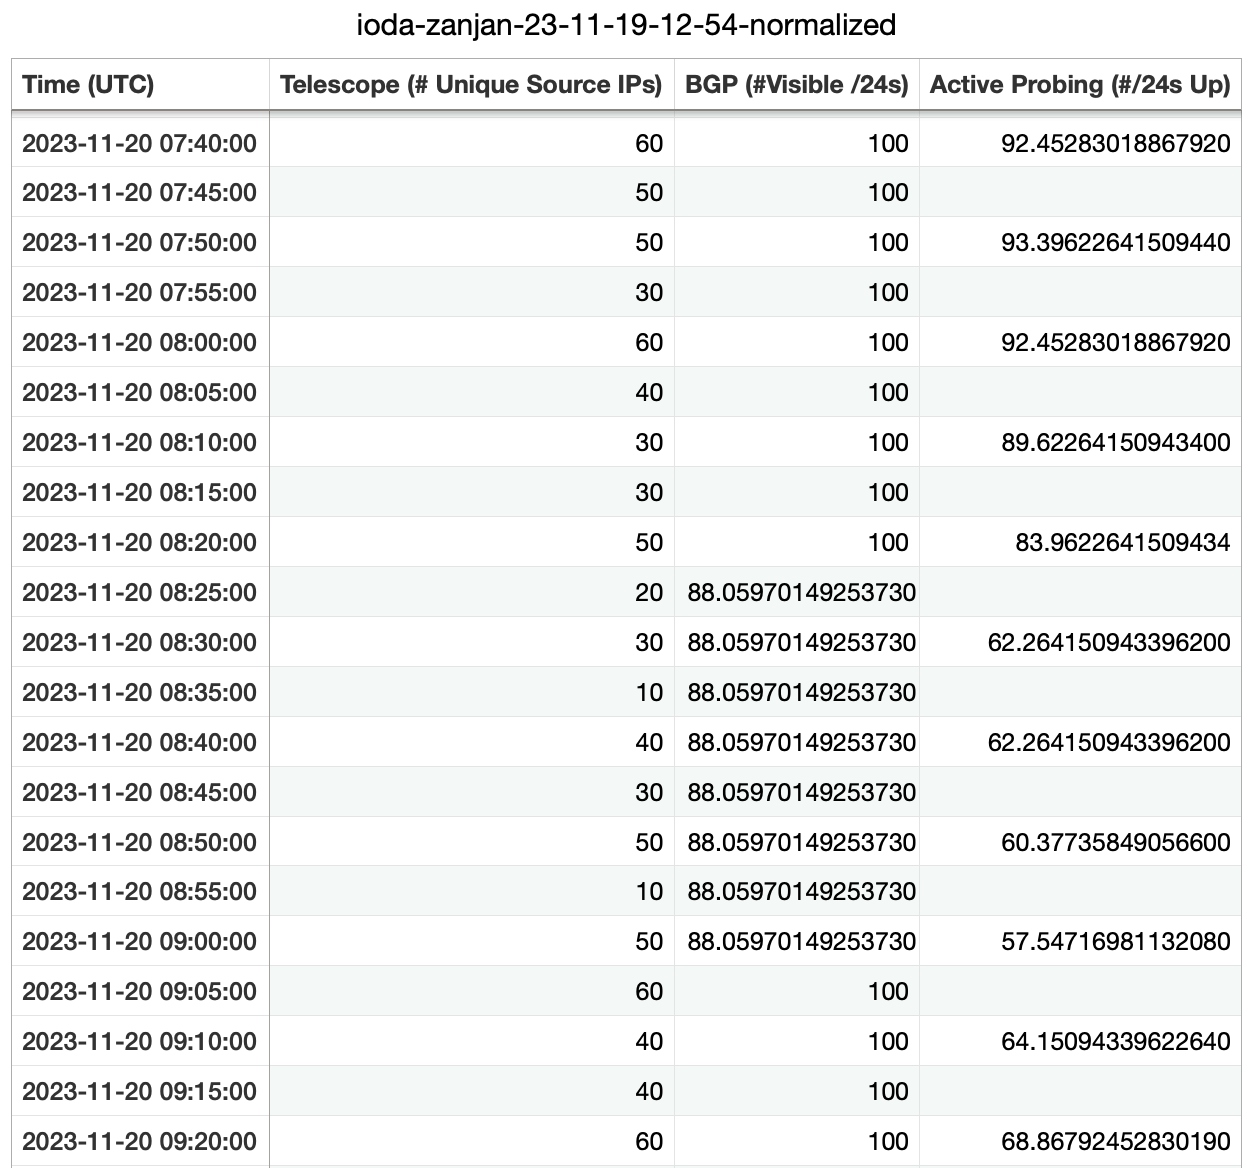
We know our user community often wants to create new visualizations or conduct analyses using IODA data. The API is not always accessible for all users, so we added a data download button. To download IODA signal values to csv, click the Download button that appears in the top right hand corner of the chart. Then click, Data CSV.
Just like the Markup Studio, make sure you have the proper time frame selected. And remember to set the chart data to either non normalized or normalized based on your needs. There is a 90-day limit for the max time frame you can select.
Gratitude
We are grateful to our team for all the work that has gone into designing and developing this functionality. Special thanks to our amazing graduate students: Arvin Poddar (front end developer), Claudia Chu (designer), Leah Cho (UX researcher), and Rachel Baker-Ramos (designer). Thank you to our senior research team: Alberto Dainotti, Zach Bischof, Amanda Meng and Shane Alcock.
Reach out to the IODA team via email at ioda-info@cc.gatech.edu