Discover the New IODA Brochure: A Must-Have Resource for Journalists
The IODA team is proud to release its infographic brochure — a comprehensive resource designed to empower journalists to better understand how to use IODA data to access real-time and historical insights into global Internet disruptions at a macro level. In addition to journalists, this research can be used by digital rights researchers and users new to IODA to see how to use IODA data to report on Internet disruptions.
What Is IODA?
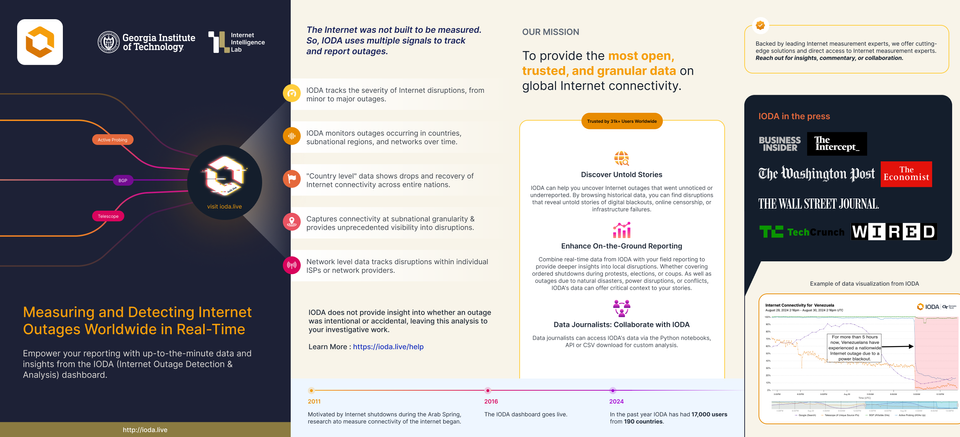
IODA (Internet Outage Detection & Analysis) is a trusted platform, relied upon by over 31,000 users worldwide, that monitors and analyzes Internet outages in real time. The IODA dashboard provides up-to-the-minute data, helping journalists discover untold stories of digital blackouts, online censorship, infrastructure failures, and more. By browsing historical data, users can uncover disruptions that may have gone unnoticed or underreported, providing critical context for investigative reporting and research.
Key Features Highlighted in the Brochure
- Real-Time Outage Tracking: IODA tracks the severity of Internet disruptions, from minor to major outages, across countries, subnational regions, and individual networks.
- Granular Data: The platform offers country-level, regional, and network-level insights, capturing connectivity drops and recoveries with unprecedented detail.
- Multiple Data Sources: IODA uses a combination of active probing, BGP, and telescope data to monitor Internet health, ensuring robust and reliable detection of outages.
- Support for Data Journalists: Journalists can access IODA’s data via Python notebooks, API, or CSV downloads, enabling custom analysis and deeper storytelling.
- Collaboration and Expertise: Backed by leading Internet measurement experts, IODA offers direct access to insights, commentary, and collaborative opportunities for those seeking to understand or report on Internet disruptions.
Empowering Reporting and Research
The brochure emphasizes IODA’s mission: to provide the most open, trusted, and granular data on global Internet connectivity. Whether you’re covering government-ordered shutdowns during protests or elections, reporting on outages caused by natural disasters or conflicts, or investigating infrastructure failures, IODA’s data is an invaluable resource for enhancing on-the-ground reporting.
A Decade of Impact
Motivated by the need to measure Internet connectivity during the Arab Spring in 2011, IODA’s research and dashboard have grown into a global platform. In the past year alone, IODA has served 17,000 users from 190 countries, reflecting its expanding role in supporting transparency and accountability in the digital age.
Get Involved
IODA invites data journalists, researchers, and technologists to collaborate, explore the platform, and utilize its data to uncover new stories and provide critical context to the world’s digital events.
For more information or to start exploring real-time global Internet disruptions, visit ioda.live.
Download the new IODA infographic brochure today and join a global community dedicated to making the Internet more transparent and resilient. You can also download the printable pdf version to share in-person. And please check out more of our user guides in the tutorials section of our user resource hub.
We would like to recognize Anezka Virani our design lead for this project. We are grateful for her participation and leadership. Please reach out the the IODA team with any questions or comments at ioda-info@cc.gatech.edu.